Collection and normalization of the daily/weekly data
First and second wave definition – Table of the data
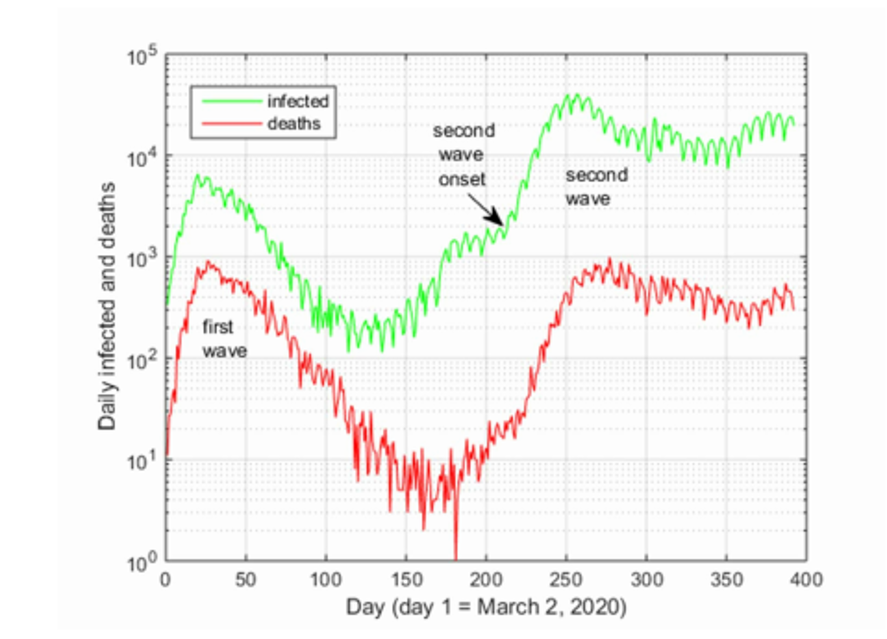
The daily number of laboratory tests, confirmed cases, and deceased related to SARS-CoV-2 were collected from the Reports of the Italian National Institute of Health (ISS) and grouped in a week-based manner . The time span under analysis covers 56 weeks (from W1 to W56): the first monitored day (day 1) is March 2, 2020, while the last one (day 392) is March 28, 2021.
| Wave |
From |
To |
Weeks |
| First |
Day 1- March 2, 2020 |
Day 119- June 28, 2020 |
W1-W17 |
| Second |
Day 218- October 5, 2020
| Day 392 - March 28, 2021 |
W32-W56 |
The two datasets (cases and deaths) were normalized to the maximum of each ensemble.
See Balasco et al. for details
Daily cases, deaths, and tests (swabs) collected from the Reports of the Italian National Institute of Health (ISS).

Week definition with starting and ending date
| Week |
Starting Date |
Ending Date |
| W0 |
24-feb |
01-mar |
| W1 |
02-mar |
08-mar |
| W2 |
09-mar |
15-mar |
| W3 |
16-mar |
22-mar |
| W4 |
23-mar |
29-mar |
| W5 |
30-mar |
05-apr |
| W6 |
06-apr |
12-apr |
| W7 |
13-apr |
19-apr |
| W8 |
20-apr |
26-apr |
| W9 |
27-apr |
03-May |
| W10 |
04-May |
10-May |
| W11 |
11-May |
17-May |
| W12 |
18-May |
24-May |
| W13 |
25-May |
31-May |
| W14 |
01-Jun |
07-Jun |
| W15 |
08-Jun |
14-Jun |
| W16 |
15-Jun |
21-Jun |
| W17 |
22-Jun |
28-Jun |