


Epidemiological and mutational analysis of SARS-CoV-2
RECOVER-COVID19
RicErCa e sviluppO VERsus COVID19 in Campania
First wave - Analyses and findings
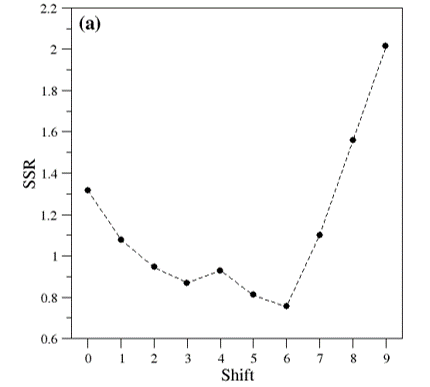
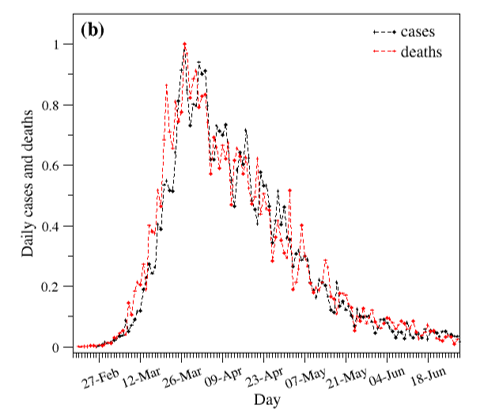
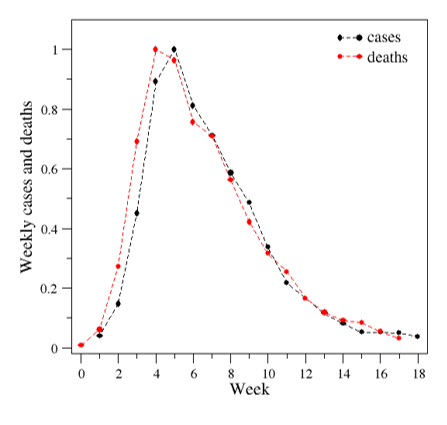
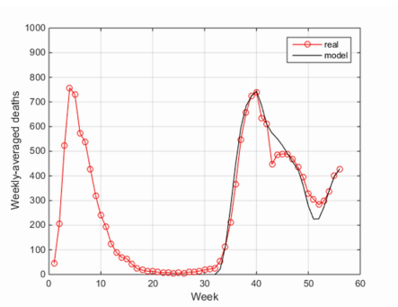
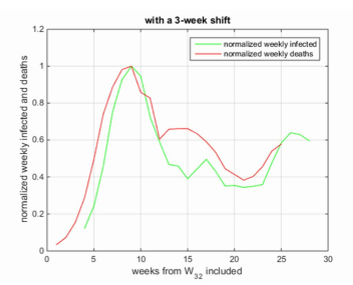
For the first wave, the best fitting was achieved by applying a six-day shift. The application of this shift produces a very good overlap between the two curves. The same analysis carried out on normalized weekly-averaged data indicated that the optimal fitting is obtained by a one-week shift, with a fairly good matching over the initial weeks and an excellent overlap in the regions beyond the peak
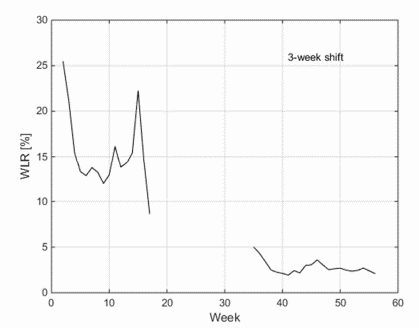
Evolution of the weekly lethality rate
The inspection of the WLR evolution during the first wave indicates that this parameter assumes rather high values (range 15-25%) in the first weeks (W2-W4), likely dictated by a marked underestimation of the number of cases in the same period. In W5-W13, the WLR was rather constant with an average value of 13.6% (± 1.2 SD). The parameter starts to fluctuate in the following four weeks while retaining a rather high average value (15.2% ± 5.6 SD).
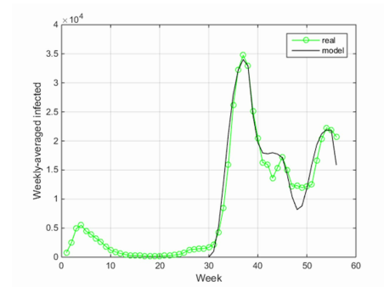
Second wave - Analyses and findings
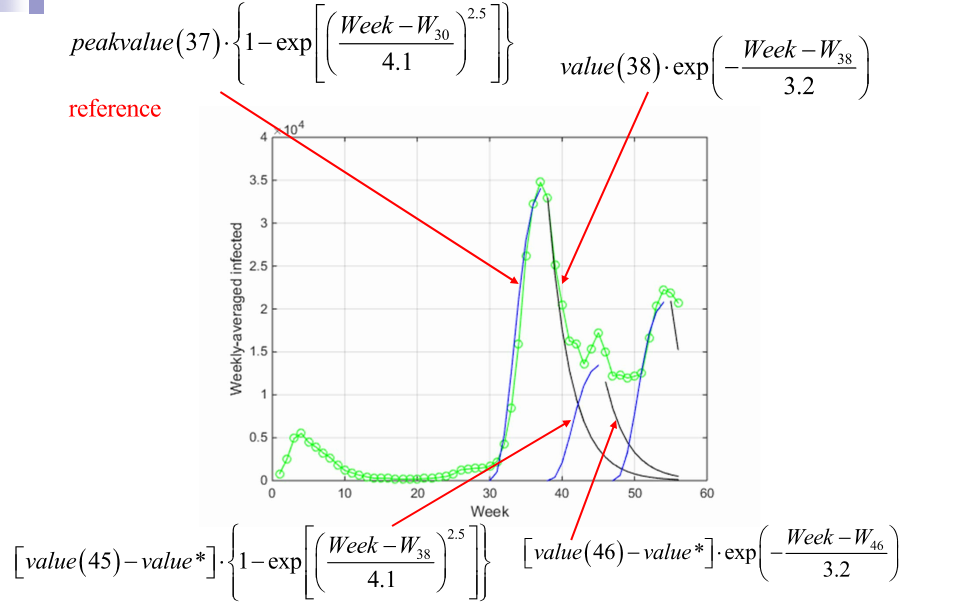
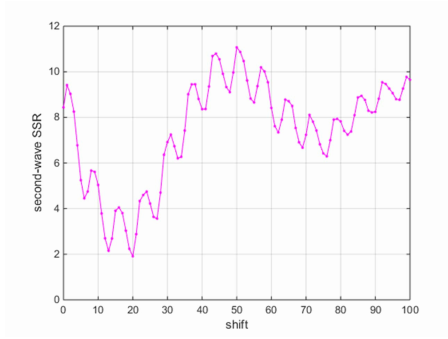
Normalized data indicate that the second wave presents an articulated behavior as different peaks/shoulder can be identified.
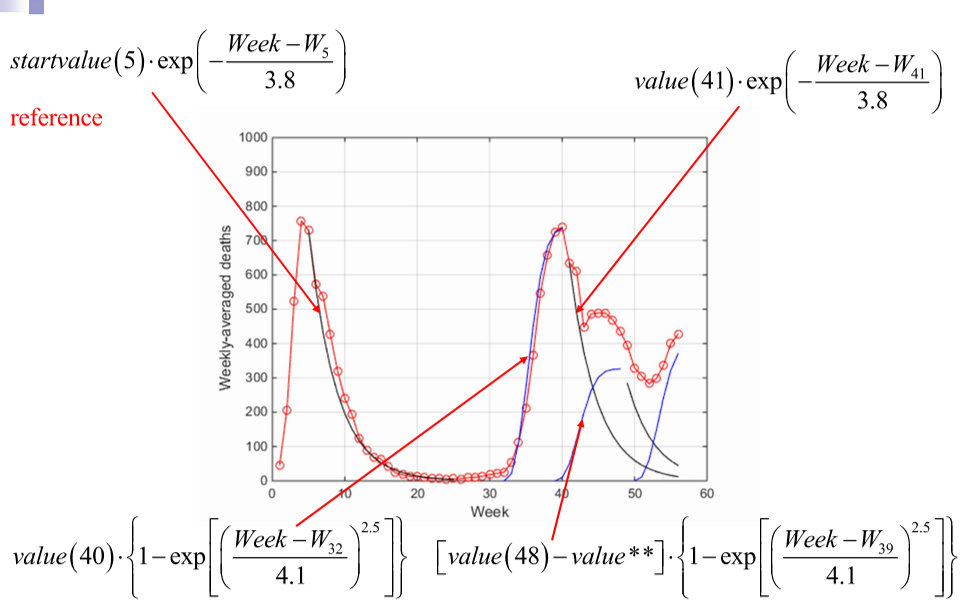
Interpretation of the curves in terms of pandemic phases
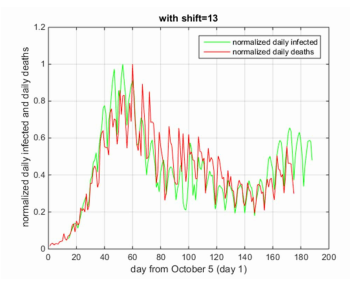
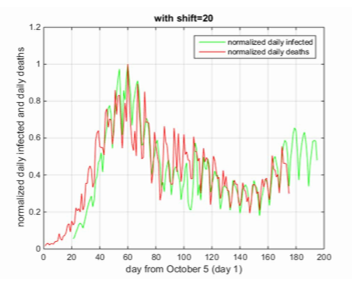
Excellent overlaps in the normalized infected/deaths are obtained for a daily shift of 13 or a 2-weeks shift, at least for the initial rise period.

Evolution of the weekly lethality rate